Section 1.1
Why you should read this
You may well be asking yourself why you would want to read a document on Taxonomies in ERP (Enterprise Resource Planning) Systems or Business Intelligence (BI) / Data Warehouse (DW) investments.
Following are some reasons you might want to consider:
1. You are frustrated that you cannot get the information you need from your ERP / BI / DW investment
2. You know that the Financial Mail has reported that "19 out of 20 ERP Implementations do NOT deliver what was promised" and want to prevent that happening to you or have it and want to get out of that situation
3. Gartner has reported that despite massive investments "most organizations are NOT making better decisions than five years ago" and you do not want that or have it and want to get out of it
4. You are seriously considering trashing your present systems out of frustration and are wondering what to do
5. You can identify with the CEO who rated his executive information systems at 1 out of 10 where 0 = "non-existent"

6. You have spent millions but cannot get answers to questions relating to data you KNOW is in your database
7. You have heard horror stories of corporations damaged by defective system implementations and want to make sure it does not happen to you – see the Harvard Business Review article "Why Your IT Project May Be Riskier Than You Think" at the end of this volume.
All of these situations are directly and dramatically POSITIVELY impacted by the material contained in this document, I encourage you to read further...
Section 1.2
Typical needs
The typical needs that would drive a decision to invest in Strategic Engineered Precision Taxonomies and Precision Configuration are:
1. Improved decision support
2. Greatly improved reporting
3. Answers to questions you have not previously thought to ask
4. Automated roll-up of information
5. Ease of electronic drill down
6. Reliable, high quality data and information
7. High levels of information ownership and accountability
Improved operating efficiency and effectiveness
Section 1.3
Problem description
At a very practical level what are the problems your organization might be experiencing that would point to the JAR&A Strategic Engineered Precision Taxonomy approach being relevant?
Following are some problems I frequently encounter:
1. Spent millions – no answers
A frequent complaint I hear from executives is "we have spent millions but I cannot get answers to simple questions even though the transactions are being processed".
SEPT configuration is the answer to this problem.
2. No accurate production unit costs
Executives frequently complain they cannot get accurate production unit costs – one CEO whose company was developing a new mine said to me "James, I have spent 27 million on … (big brand ERP), I have ONE tunnel, they cannot tell me how much it is costing per meter to drive that tunnel, in one years' time I will have eighty tunnels, what am I to do?"
I subsequently learned that that same organization employed a highly competent lady with a Bachelor of Commerce degree and five years of post-graduate experience who had not managed to produce a viable income statement in six months and that the senior bookkeeper had spent six months whittling down the Chart of Accounts to 16 pages of accounts from 25 pages based on what she considered relevant. It finally turned out that the Chief Financial Officer was managing the finances in Excel and merely pretending to use the ERP!
They had the second worst Chart of Accounts I have ever seen – a Chart of Accounts which did not comply with any of the principles advocated here. Yet a Chart of Accounts with regard to which the big brand ERP software vendor declared "… is so powerful it can handle that" – totally ignoring the fact that the Chart of Accounts made no logical sense whatsoever, a characteristic of many Charts of Accounts which results in implementers making a fortune with ongoing support while executives mistakenly believe they do not understand IT when they should instead be taking a stand for quality taxonomies.
A badly designed Chart of Accounts recently contributed to a Chief Executive of a large listed company being fired after a badly configured big brand ERP was reporting increased profits while, in fact, the profit was a loss because some expensive consultant had accidentally reversed the posting accounts for the debit and credit side of certain transactions in the configuration.
A series of SEPT taxonomies would have solved both of these problems.
3. No accurate end- to-end product costs
Another CEO of a manufacturing group in which several business units added value to basic materials to create high value products complained that he could not get sight of the end to end chain of value addition and cost addition for his finished products. Once again badly classified and badly configured data was the cause.
A SEPT Item Master taxonomy coupled to precision configuration would have solved his problem.
4. Nobody trusts the system
I constantly encounter businesses where most of the business is run in Excel and add-on software packages because people do not trust the data in the system.
SEPT configuration properly implemented and operated is the answer to this.
5. Reports do not agree / do not make sense
It is an everyday occurrence in most corporations that they have numerous simple reports that do not agree or do not make sense, each person has their own variant which they trust but the overall totals do not agree. Frequently this relates to badly designed and badly configured validation lists and Master Data.
SEPT configuration is the answer to this.
6. Still getting huge bills from implementers
It is a regular occurrence that organizations continue to pay huge monthly fees for support of their systems or to employ expensive personnel to maintain reports and general configuration because the configuration is so clumsy and imprecise that the consultant or staff member is frequently the only person who can make some sort of sense of the data.
SEPT configuration is the answer to this.
7. Our data does not make sense
Executives frequently tell me that they do not understand IT – on closer examination this translates to the data being so badly configured that it makes no sense at all and does not in any meaningful way model the real world -- so executives, when they cannot make sense of the data, assume there is something magical that IT people know that they do not in order to make things work, frequently ignoring the harsh reality that it is the same people who are responsible for the mess in the first place.
Ultimately the CEO MUST be the custodian of any integrated system such as an ERP, Data Warehouse or Business Intelligence installation and the configuration MUST make sense to the CEO. This requires a SEPT configuration designed and implemented from the executive suite.
8. Lack of an effective group consolidation model
Most corporations lack anything approaching a comprehensive Group Financial Consolidation model that is anything more than a set of summarized financial statements. The JAR&A SEPT Financial Taxonomy solution (Cubic Business Model and Group Wide Master Chart of Accounts) provides a solution that enables comprehensive Group Wide financial analysis and modelling.
It also provides a mechanism for rapidly mapping and analysing the financial performance of potential acquisitions during due diligence and of rapidly integrating acquisitions when they come on board.
9. Etc
There are numerous other problems that you may be experiencing that are giving rise to frustration, doubting the software you have bought, etc. In the vast majority of these cases a comprehensive SEPT configuration coupled with Strategic Customization well designed and well implemented to JAR&A standards and well operated is the answer.
Strategic Engineered Precision Taxonomies really can make a huge difference to your Integrated Business Information System (IBIS), ERP, DW or BI investment and enable you to massively leverage your existing investments.
Section 1.4
What is a Strategic Engineered Precision Taxonomy (SEPT)
to JAR&A Standards?
The following is an overview of what constitutes a Strategic Engineered Precision Taxonomy to the standards that I have developed over the years:
1. Semantic structure
Fundamentally a taxonomy is a logical word or semantic structure – it depicts the real world in a carefully structured hierarchical list.
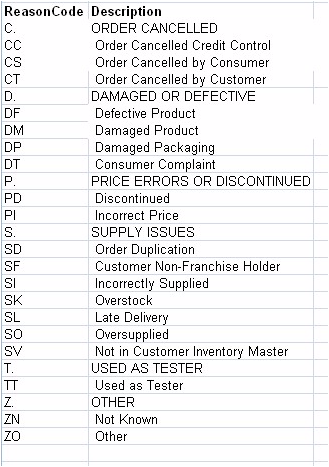
The following figure depicts a very simple taxonomy of Credit Note Reason Codes:
2. Precision vocabulary or preferred terms
In defining a taxonomy the choice of words is important – a limited and specific vocabulary should be used such that the same concept or element is always described with the same word or phrase. There is a difference between "Factory" and "Manufacturing".
3. Conveys understanding
A taxonomy succinctly conveys understanding between human beings with related knowledge and experience.
A strategic taxonomy conveys an executive view of the strategic priorities of the business all the way down to the most junior clerk who posts against that taxonomy.
4. Hierarchical strategically structured list
A Strategic Engineered Precision Taxonomy is a hierarchical (nested) structured list relating to any specific attribute stored in a computer system ranging from the most simple to the most complex.
5. Precision code scheme
In the context of this document not only is a taxonomy a precision semantic (English language) structure but this is, in turn, linked to a precision code scheme which conforms to the standards that I have developed over the years with regard to number of elements at any level in the hierarchy, gap coding, capitalization of headings, trailing periods against headings, use of numeric, alphanumeric or alpha coding, mnemonic coding including conventions for mnemonic coding relating to correlation to vowels and consonants, etc.
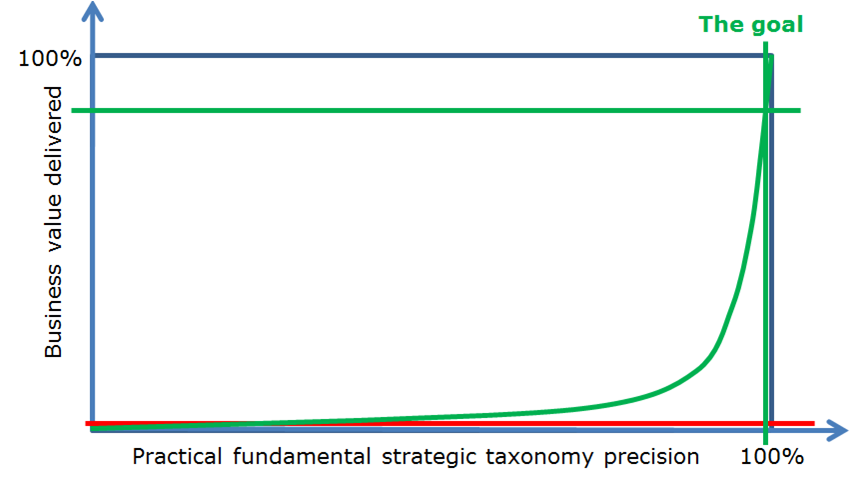
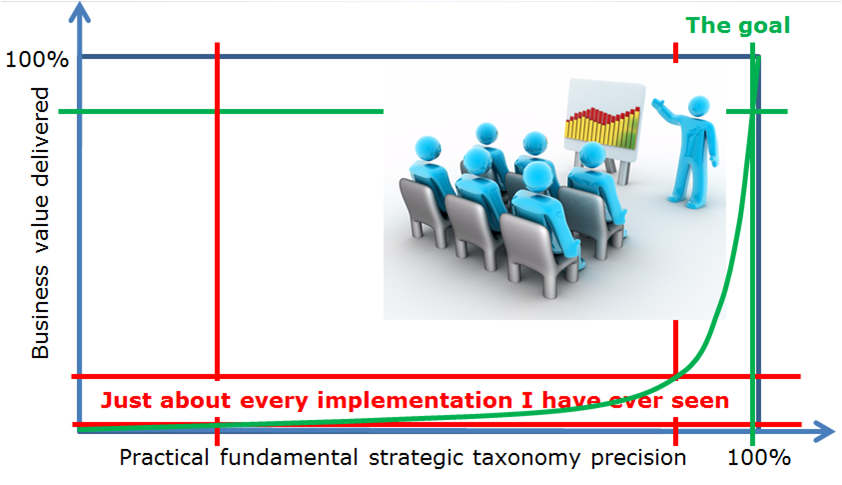
The following diagram gives an indication of how critical precision is in delivering value
6. An Art and a Science
The development of a strategically valuable sustainable taxonomy is both an Art and a Science and requires significant levels of knowledge and experience to originate.
There are rules but a lot of what is required to craft a taxonomy that really works is intuition based on comprehensive understanding of business, information technology, language, logic, etc.
7. Precision communication tool
A precision taxonomy is a precision communication tool that requires adherence to a range of standards and conventions in order to achieve its full potential and communicate a consistent picture across all users.
8. Add's value to users from the CEO to the most junior supervisor (Team Leader)
A precision taxonomy adds value to all users of the information in the system, from the CEO who is able to get answers to all possible questions, including those not thought of previously and drill down to detail at the touch of a button to the clerk who needs to post fast and accurately and harness the power of software system intelligence linked to workflows, business rules, etc.
9. Time consuming and tedious to develop – once right it seems obvious
Strategic Engineered Precision Taxonomies to JAR&A standards are time consuming and tedious to develop and observers may question why it is taking "so long" but, IF well designed to cater for all business eventualities a precision taxonomy seems "obvious" at the end.
The more complex the taxonomy the more time consuming to develop it.
10.Software tools can enhance development
The use of software tools can enhance the development of precision taxonomies both in terms of speed and precision.
The above list contains the main elements that define a Strategic Engineered Precision Taxonomy.
Section 1.5
History of the JAR&A
Strategic Engineered Precision Taxonomy (SEPT) approach?
This document outlines how the James Robertson and Associates Strategic Engineered Precision Taxonomy (SEPT) approach has developed over a period of nearly forty years.
1. Early days – late 1960's – practical application of existing taxonomies – insects first and then butterflies
2. Early 70's – Computer Science for Engineers – finite element analysis and other techniques – precision in data definition and complex repetitive calculations, statistical and presentation techniques
3. 1977 – detailed study of catalogue design principles – design of a very complex taxonomy for my PhD research – ultimately used to make sense of over 7,000 pages of laboratory data in a prize winning PhD thesis
4. 1982 – first high value decision support solution designed and built – client organization doubled turnover in twelve months by supplying the right information to the right people at the right time in order to make the right decisions – high value investment decisions which gave rise to dramatic earnings
5. 1981 to 1984 – grounding in economics – how business and economies work
6. 1980's – the NATO filing system – a very complex document storage and retrieval catalogue system
7. 1987 to 1990 – first ERP implementations – some good and some bad – hard lessons about the psychology of change
8. 1990 – one thousand hours of unremunerated research and development – the Cubic Business Model General Ledger Chart of Accounts taxonomy solution – first use of software tools – developed standards that remain in use today – tried and tested
9. 1993 – dramatic ERP win – V3 Consulting Engineers – "fantastic -- more management information than we know what to do with" plus dramatically reduced audit time and cost and headcount reduction – refer white paper
10. 1993 – Price Forbes – CRM Risk Control – insurance loss control system for SA Post Office – "fantastic -- more management information than we know what to do with" plus saving of eight clerks and dramatic increase of information captured – simple software with quality taxonomies delivers massive benefit – refer white paper
11. 1994 – Rennies Group – Strategic Master Chart of Accounts taxonomy across over 100 companies with dramatic results – refer white paper
12. 1994 to 1995 – clever technology does NOT compensate for the lack of taxonomies – major software development that failed because of lack of taxonomies – hard lesson that I did not yet know my own techniques and strengths well
13.1996 to 2002 – diverse projects, taxonomies low profile, strategic analysis methods, software sustainability, etc
14. 2003 – Financial Mail reports that "19 out of 20 ERP implementations do not deliver what was promised" – executive level view of non-performance – reinforces my findings of a 70% outright failure rate
15. 2003 – fourth generation of StratSnap software, JAR&A catalogue of the factors causing IT and ERP investment failure and the Critical Factors for Information Technology Investment Success with particular emphasis on ERP – start presenting courses
16. 2003 – wrote the book "The Critical Factors for Information Technology Investment Success". Published in 2004. Expanded portfolio of courses
17. 2005 – Gartner reports that despite huge investments in Business Intelligence technology "most organizations are NOT making better decisions than they did five years ago" – reinforces my conviction of the importance of taxonomies but still not seeing the full importance
18. 2005 to 2007 – diverse projects – some taxonomies, many other aspects of system implementation and StratSnap Critical Issues Strategic Analysis Approach
19. 2007 to 2008 – African Sales Company – taxonomy driven ERP implementation – software to manage a critical taxonomy in Syspro (the Product Class) and build associated sophistication (which I was told "could not be done") – final result a "strategic resource" – refer white paper
20. 2009 – opposition and "James you are the only person in ERP in South Africa who understands taxonomies" and discover to my surprise that big brand implementers do NOT know how to implement their software to full potential
21. 2010 – major Group Consolidation Chart of Accounts for Foodcorp in association with EOH Impact Africa and Group Chart of Accounts for MoreGolf Group – developed GL Builder software – some lessons with regard to implementation, post implementation support and need for software tools to accelerate processes, increase speed, reliability and sustainability
22. 2010 – finally got that taxonomies were THE MOST CRITICAL ELEMENT of ERP and business system implementation AND that seemingly no one else knew what I did – started to "evangelize" taxonomies and give much more detail in my courses – developed high level specification for a comprehensive suite of taxonomy software – Project Butterfly – alliance with Nicolaas Hugo
23. 2011 – current clients in Steel and Mining sectors looking at major green field data warehouse projects using Strategic Engineered Precision Taxonomies to JAR&A standards – the method is finally coming of age – discovered that the real cost of re-implementing an ERP is more than just about any organization can justify – new data warehouse with Strategic Engineered Precision Taxonomies and THEN trickle taxonomies down into the ERP
The above gives a headline level history of how the approach has evolved over the years in tandem with other milestone events in my career which have informed, confirmed and supplemented my overall outlook and approach to business information systems.
It has been a long and challenging journey but the benefits of the approach are huge, I have every confidence that this approach will have a MAJOR impact on business information systems and will redefine standards with regard to ERP implementation worldwide.
Strategic Engineered Precision Taxonomies RAISE THE BAR for ERP and Business Intelligence Worldwide!
Section 1.6
What is NOT a Strategic Engineered Precision Taxonomy?
In seeking to explain what a Taxonomy is it is useful first of all to consider what a Taxonomy is NOT.
In particular, what is NOT a Strategic Engineered Precision Taxonomy.
Following are a few examples of lists from ERP implementations which are NOT taxonomies:
1. Credit note reason code example
The following example of Credit Note Reason codes is NOT a Taxonomy:
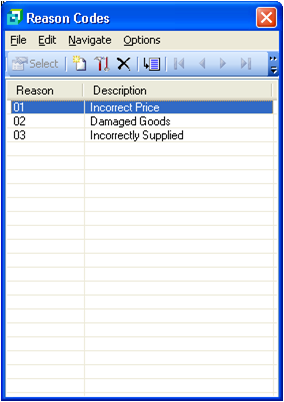
At first glance this might look reasonable, however, the list is coded sequentially and there is no information about the nature of incident that gave rise to the Credit Note.
Any management query relating to the nature of damage or the nature of incorrect supply will necessitate a fairly senior person to go to the database and analyse the transactions.
Typically this will require exporting the transactions into Excel and then creating some form of manual analysis which can then be supplied to management in order to answer the question "what was the nature of …". In the event that this report triggers further questions it will be necessary for the same reasonably senior person to return to their spreadsheet and look for answers to those further questions.
If, as frequently happens they only brought the information they needed into their spreadsheet they may need to do another query and do further analysis which, because it is all manual, may not exactly return the same results of the first query resulting in frustration and distrust of the system.
Contrast this with the following SEPT list produced in consultation with the management of the particular client organization concerned:
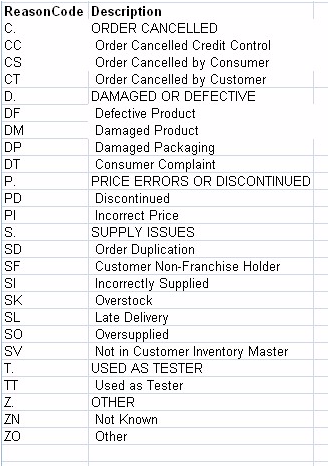
It will be apparent that there is considerably more information available for analysis in the base data before further analysis is required. If, in addition to this well-structured list there are other well-structured lists throughout the ERP Database then considerable further information can be extracted without the need to pull data into Excel and analyse manually.
Note also that as far as possible the codes are mnemonic and therefore it is quicker and easier to remember codes and post and also the code structure permits summarizing analysis.
2. Chart of Accounts in big brand ERP
Following is an extract from the Chart of Accounts in a multi-million Rand big brand ERP implementation that had to be trashed.
At the start of the Pulse Measurement Investigation the Chief Executive of the client corporation said to me "James, I have spent … million on this ERP installation, I have one production unit at present and they cannot tell me the cost per operational unit of that one unit, this time next year I will have eighty such units, what do I do?" In this case the client was seriously considering trashing their big brand ERP and buying another big brand ERP.
During the investigation I found that the client had employed a highly capable lady with a Bachelor of Commerce degree and five years' work experience who after six months of intense effort was unable to produce an Income Statement that was reliable!
Here is an extract from the Chart of Accounts:
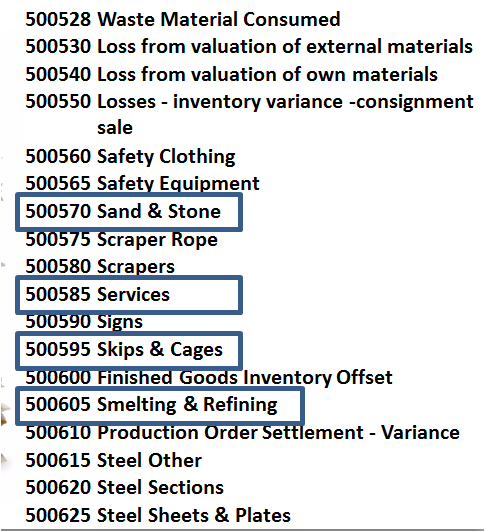
Notice that "Sand and Stone" is about as consumable an item as one can find, two accounts away from "Services" which was likely to be a fairly large expense, one account removed from "Skips and Cages" which are large capital assets and one removed from "Smelting and Refining" which was a capital asset amounting to hundreds of millions of Rands, but notice also that "Smelting and Refining" might also be related to operating expenses and NOT assets.
Notice that "Steel Other" occurs BEFORE other items relating to Steel whereas "Other" should be the posting of last resort.
Notice that "Scraper Rope" occurs after "Scrapers" where the rope is a component of the scraper.
Notice also that there is no pattern or logic in the coding either.
One of the business personnel responsible for this Chart of Accounts proudly told me that he had consulted a number of other businesses and pulled in everything that they had in their Charts of Accounts as well.
The senior Bookkeeper subsequently informed me that when she started with the company the Chart of Accounts ran to twenty five pages and she had spent six months narrowing it down to a list of sixteen pages in order to make it useable.
During a system walkthrough attended by the Client, the Implementers and representatives of the big brand software company when I pointed out the weaknesses of the Chart of Accounts one of the software company representatives started to argue with me that his software was "so powerful it can cope with that" – an absolutely foolish statement insofar as the issue I was raising related to a complete lack of logic or structure in the data.
At a subsequent meeting with the same representative he persisted in insisting that the Chart of Accounts was not that bad and referred me to the "Best Practice" Chart of Accounts off his company's website.
When I obtained that Chart of Accounts, this is what I found:
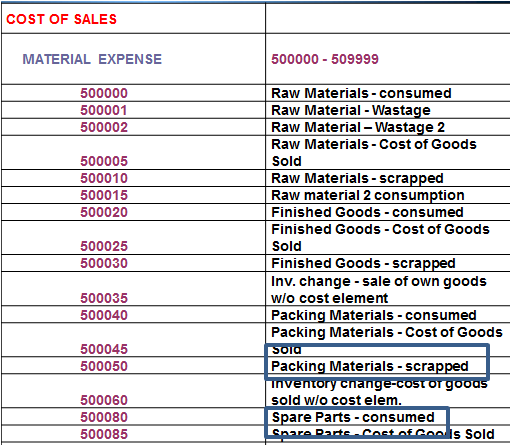
Again virtually no logic, no structure, no pattern in the coding, in fact seemingly completely arbitrary numbering.
He was right, the highly defective Chart of Accounts in the implementation of his client was NOT much worse than the so-called "best practice" Chart of Accounts.
At that point I understood for the first time that the large global organizations that sell and implement big brand ERP systems did NOT understand principles that I regarded as fundamental and essential to effective ERP implementation. I also understood more clearly why such implementations so frequently run over time and over budget.
Subsequently I have encountered similar deficiencies in sample data for various other big brand ERP products.
There is a HUGE opportunity to enhance your current ERP and BI investments using SEPT.
3. An example of a well-designed (SEPT) Chart of Accounts
So, what DOES a well-designed Chart of Accounts to JAR&A SEPT standards look like?
Following are some extracts from a Group Consolidation Chart of Accounts that JAR&A developed for a large manufacturing group recently:
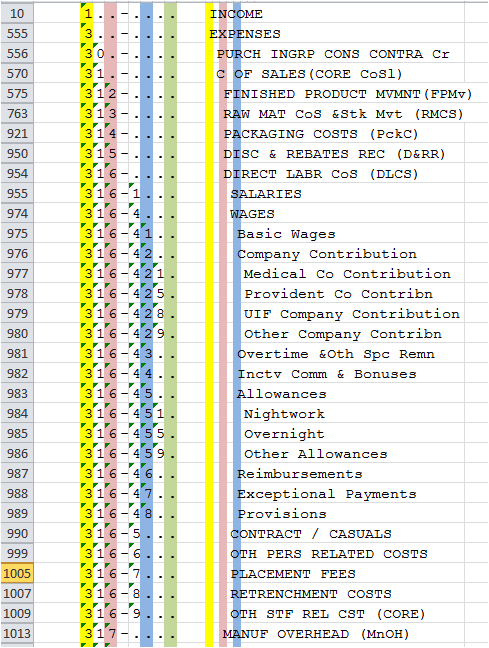
As you will see from the spreadsheet row numbers in the left hand column many rows have been hidden in the spreadsheet in order to make the hierarchy more readily visible.
Only the section relating to "Wages" has been left open at the lowest level of the seven level hierarchy to give some idea of the posting level detail.
The colours in the columns are simply to make the hierarchy easier to follow during development.
Notice the use of the delimiter "-" in the code scheme in order to break it into segments that make it easier to read and remember.
Notice also that headings in the hierarchy are in Capital Letters and that the hierarchy is indented to make it easier to scan and read.
Notice the trailing periods "." in the codes that correspond to the levels of headings in the hierarchy, these periods make the code easier to read, the hierarchy easier to follow and permit the incorporation of intelligent interpretation of the hierarchy in software, query and reports that work with the hierarchy.
Notice also that codes are spaced out over the full available range in order to provide space to add in extra items in the correct location if ever required.
Following is another view of the same Chart of Accounts:
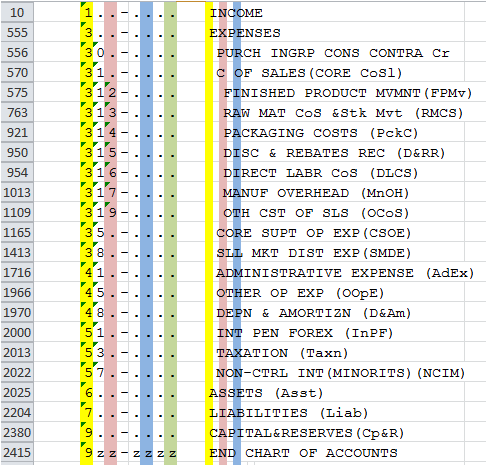
Here the accounts have been collapsed at the first level of the hierarchy with the exception of Expenses which is opened up at the second level and Cost of Sales which is opened up at the third level of the hierarchy.
What you will notice here is that a straight forward listing of the Chart of Accounts I.e. a Trial Balance gives a detailed Income Statement and detailed Balance Sheet and that only minimal further work is required to produce formal detailed Income Statement and Balance sheet.
This is in dramatic contrast to the previous examples where even the simplest Income Statement will takes days or weeks of work by an expensive resource to produce reports which may not even be very accurate.
At about the same time that I had the debate with the representative of the software company with regard to the "power" of their ERP I encountered another situation with another big brand ERP implemented at about the same time.
In this case the Chief Executive had just been forced to resign when, following implementation of his new big brand ERP by big brand implementers he had consistently reported to shareholders over a six month period that profits were improving significantly. At the end of the six months, when there was no money left in the bank he had to report that as a consequence of a configuration error in his big brand ERP the profit that he had been reporting was, in fact, a loss!
Someone had accidentally swapped the debit and credit accounts around somewhere in the configuration with the result that the financial statements were in error.
If you contrast the SEPT Chart of Accounts above with the examples earlier I am sure you can see how easy it is with the former Charts of Accounts to make such a mistake. Software vendors may well argue that their way of doing things is normal practice, that may be so but it does NOT make it acceptable practice, let along good practice and certainly NOT best practice as the man from the big brand ERP vendor had asserted to me.
Yes, there ARE grouping codes and other devices in these big systems to try and add logic to these illogical lists but, I hope by now you will agree with me that it is MUCH EASIER to build the logic in the foundational list from the start.
Notice that with the highly structured SEPT Chart of Accounts above a five line financial report summarizing the entire Chart of Accounts in account number order will give the balancing totals for the Income Statement and Balance Sheet and immediately show whether the accounts are in balance or whether there has been a posting error or configuration error somewhere.
When this is combined with the JAR&A Cubic Business Model superimposed on the General Ledger, every Location–Function element of the business has its own Income Statement and, where applicable, Balance Sheet and all performance management takes place directly off the GL with a dramatic improvement in Governance AND reduction in audit time and cost.
Couple this model to the configuration of all other modules and it becomes immediately possible to drill down on a value in the General Ledger into the source systems in order to obtain additional detail (assuming of course that you have SEPT configuration in all the other systems as well).
Note that you can achieve a significant proportion of this benefit by implementing SEPT configuration in your Data Warehouse and just tuning the poor lists in your ERP, which in most cases will be working after a fashion for operational purposes.
These problems occur in every area of every ERP I have ever looked at.
Another element of the Chart of Accounts above is that the expenses are sequenced from the most strategically fundamental to the most routine so that every person who accesses the Chart of Accounts has the Executive Strategic view of the financial priorities of the organization. This alone carries with it significant organization optimization benefits.
Following are a few other examples of poor quality data in major ERP implementations.
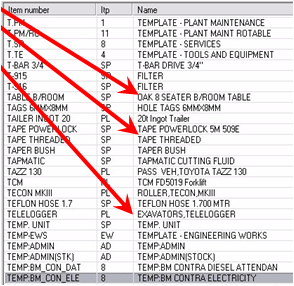
4. Item Master in a big brand ERP
5. Item Group in another big brand ERP
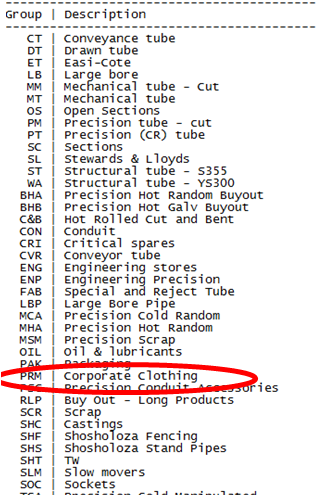
Again, no logic, no structure, nothing that corresponds with the concept of a logical way of grouping items.
6. Material Group in another big brand ERP
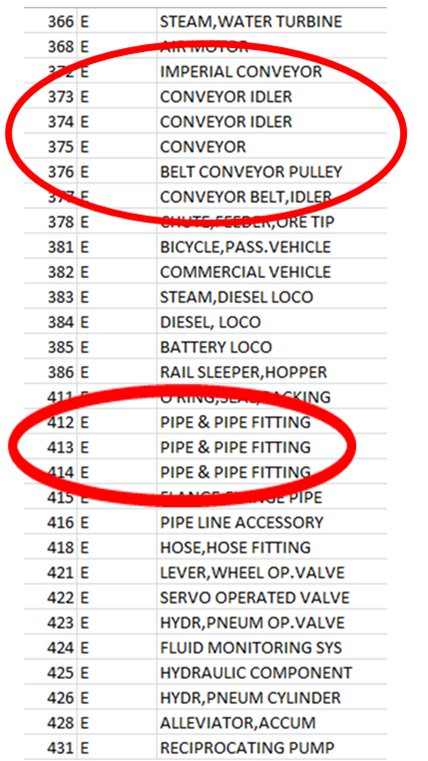
Duplication, no logic, no structure and nothing that gives any indication of a logical basis for "grouping" materials.
7. Etc
I could go on and on giving you examples but I hope that the above will have sensitised you enough to provide the incentive for you to go and have a look at the tables in your own ERP.
While they may not be as bad as the examples here, my experience tells me there is a fairly good chance they WILL be comparably defective or that, at best, they may be some limited way towards the recommended SEPT practice examples above.
I hope that this will provide you with the incentive to read further!
Section 1.7
Taxonomy principles
This document summarizes some important taxonomy principles relating to Strategic Engineered Precision Taxonomies as applied by JAR&A.
1. High value business decisions
Value is unlocked through effective delivery of information that is intuitively fundamentally meaningful packaged in a way that the computer system APPEARS to be intelligent and presented through reports, graphs, dashboards, advanced statistical techniques, advanced economic analysis and other advanced techniques of information presentation, analysis and interpretation.
This supports MUCH BETTER strategic, tactical and operational decisions that manifest in improved organizational profitability, growth, impact, etc.
2. High value intelligent information
High value business decisions require that executives can get answers to any question for which they can reasonably expect there to be answers in the databases that they know their organization has -- easily and quickly and without major effort on the part of any staff member or contractor -- the RIGHT information at the RIGHT place at the RIGHT time in order to make the RIGHT decision.
3. Value is created by business action
Value is created by business actions that deliver on the essence of why the organization exists and how it thrives. Value manifests through increased profitability, growth, acquisitions, job satisfaction and fulfilment of the strategic vision.
Value is the consequence of intuitive, intelligent, informed leadership business decisions – thrive decisions. Such decisions are facilitated, accelerated and enhanced through access to more intelligent, meaningful and relevant information.
Value is created by obtaining answers to the questions I have not yet thought to ask.
Such “intelligent information” is assembled as a consequence of high level strategic and executive level input into the design of the data CONTENT – taxonomies designed to catalogue every conceivably relevant classification ahead of time.
All taxonomies should be designed with the above principles in mind.
Section 1.8
The desired end-state
What is the average executive or manager looking for from their ERP, IBIS, DW or BI investment (or the whole package)?
Following are some objectives I frequently encounter:
1. Easy to use and makes sense
People want their systems to be "user friendly" -- user friendly actually translates to "well designed, intuitive to use, logical, makes sense, works the way I work, etc" – reality is that you can have the most technologically advanced software in the world but if the data content makes no sense that technology is valueless – Strategic Engineered Precision Taxonomies (SEPT) and configuration are the answer.
2. Accurate, consistent, reliable
Systems should be accurate, consistent, reliable, dependable – routine reports should all agree with one another; questions should be able to be answered easily.
A SEPT configuration makes this a reality.
3. System is trusted
It is vital that "the system" is trusted by all staff so that private records, private spreadsheets, private software are abandoned because the main resources of the organization are easy to understand and use.
Sounds like a technology issue?
Doesn't it?
Well, yes, thirty or forty years ago but NOT today.
Today the problem is NOT the technology it is the data and SEPT and precision configuration are the answers.
4. Costs immediately accessible
Every executive who authorizes expenditure of millions on an ERP or BI tool has a reasonable expectation that they will be able to easily and immediately get answers to all reasonable questions regarding costs.
Frequently this expectation is unmet.
The answer is precision configuration using the SEPT principles outlined in this document.
5. Rich diversity of reports and analysis
Executives reasonably expect to have a rich diversity of reports and analyses with which to manage their organization. Frequently this expectation is drowned out by the massive struggle to get even simple reports that are reliable and dependable. A precision, SEPT based, configuration is the way to achieving this requirement.
6. Hardly see the implementers
In the real world, once we have built an office block or a factory we do not expect to see the designers or constructors at all after the warranty period has expired, yet with ERP and BI we find expensive personnel on-site almost in perpetuity because of the constant maintenance burden of badly configured installations. SEPT is the answer – well configured systems are easy to operate and maintain.
7. Better decisions faster
When authorizing major expenditure on ERP or BI executives have a reasonable expectation that they will get the information they need to take better decisions faster. As reported by Gartner this expectation is seldom met.
Properly configured systems using the SEPT approach are the answer.
8. More profitable
In motivating massive ERP and BI investments organizations are promised increased profitability, yet this seldom materializes and, if it does, it occurs at the operational level and NOT the strategic level. Strategically aligned taxonomies are essential to supporting better decision making that result in a more profitable organization.
9. Headcount reduction
Many ERP investments are motivated on the basis of headcount reduction but in many cases headcount increases.
A well designed, well implemented and well managed SEPT configuration will give rise to efficiencies and MAY, through natural attrition, give rise to headcount reduction. Headcount reduction should NEVER be the motivation for an ERP investment, the investment should be made for strategic gain with headcount reduction as a spin-off if the job is done right.
Why not instead aim to GROW in order to utilize the added capacity that is unlocked by operational efficiencies?
10. Delighted with our systems
Very few executives can truly say they are delighted with their IT, ERP, DW or BI investments. SEPT provides a concept, thought process, implementation attitude and way of working that has the potential, if executed with the right executive level advisors, to achieve exceptional outcomes that you will truly be prepared to boast about J
Section 1.9
Why Taxonomy coding is important
The following are the major reasons why it is important to code taxonomies:
1. Coded taxonomies are essential
Coded taxonomies are central to and essential to the effective operation of business information systems.
2. Every validation list
Every validation list, drop down list, category list, group list, class list, classification list, etc – any list that contains logic that reflects the reality of the business or affects the way the software operates should be carefully coded in accordance with all the conventions of the SEPT approach.
This includes the Chart of Accounts and all complex logistical code tables such as the Materials Group in SAP, the Item Class, the Product Class, etc.
3. Computers only understand binary (0's and 1's)
In understanding why computer systems need codes it is vital to understand that computers only manipulate binary data (0's and 1's) and binary data is presented logically as ASCII data with 256 possible text values.
All apparent intelligence in a computer system working with data relies on what the computer does with the patterns of characters in its data.
SEPT involves the careful design of English or other language semantic (language) structures and then the careful alignment of these logical language structures with hierarchical codes using various coding conventions including trailing periods for headings, mnemonic codes, alpha codes, numeric codes, alpha numeric codes, etc chosen as required for a particular taxonomy.
For reporting, roll-up, drill-down and other electronic functionality to work effectively there must be carefully thought out logic in the code schemes which allows the fancy technology that has been available for the last fifteen years to work to its full potential.
Problems with reporting, etc are fundamentally NOT technology problems, they are problems associated with the lack of logic in lists and the lack of logic in code schemes.
4. Codes allow the computer to emulate human intelligence
These highly structured and carefully thought out codes, designed by an informed and knowledgeable human designer enable the computer system to manipulate the data electronically with ease.
If the codes are badly designed then massive increases in human effort are required to produce even the simplest reports and this is why most organizations continue to spend large sums of money on expensive consultants to maintain what should be elementary reports that should be produced at the touch of a button.
The relationship between value and precision is dramatic:
5. Intelligent data
The above elements of semantic logic and carefully matched code schemes create what I call "intelligent data" – data that contains high levels of human intelligence and which therefore allows query, reporting, dash boarding, etc tools to produce elegant and easy to interpret reports.
In the absence of intelligent data huge amounts of manual effort are required to maintain reports and multiple reports will return different results.
6. JAR&A coding and presentation conventions
JAR&A have developed a range of coding and presentation conventions such as the use of indents, trailing periods, capitalization, gap coding, seven plus or minus two elements per hierarchy level, etc in order to facilitate the creation of intelligent data.
Software tools are being developed that will facilitate the application of these standards and help to enforce consistency and rigour.
7. False to suggest codes no longer required
There is a widespread view that "because it is Windows" there is no need for codes and that only the long English or other language text descriptions are required.
The most elementary examination of this thesis will reveal it to be untrue – how do you easily write reports which summarize, roll-up and drill-down based on long language text strings, the hassle factor and room for error is huge.
Text strings do not in any manner that is amenable to electronic processing facilitate hierarchical nesting of information in a manner that a computer can easily process.
Hierarchically structured codes allow reporting on ranges, allow the ranges to be extended easily and consistently, etc.
It is just NOT possible to achieve the levels of precision envisaged here without precision structured codes associated with the precision semantic English structured taxonomy descriptions.
The above list contains the main reasons why Strategic Engineered Precision Taxonomies are coded.
Section 1.10
Differentiators
Why is the JAR&A SEPT approach different and better?
1. Birthed out of a focus on high value decision support
2. Founded on insistence of understanding the strategy – essence of the business and how it thrives – the fundamentals of the business
3. A level of taxonomy precision and discipline not seen anywhere else
4. Conventions and standards designed for ease of human engagement in terms of posting and inquiry – cognitive span and other visual and logical techniques
5. Conventions and standards designed for ease of electronic manipulation of coded data
6. A holistic, integrated concept and solution
7. Sustainable, reliable, dependable, low operating cost, high value delivery outcomes IF correctly designed, implemented and utilized
8. Opens the door for opportunities that cannot be achieved in any other way
9. The FUTURE of business information system configuration and operation
Section 1.11
What is different about the JAR&A ERP Implementation approach
Following is an analysis of what is different about the JAR&A approach to ERP implementation.
The goal of this approach is a MUCH higher quality outcome for the same or less total cost to exceptionally high standards. Long term operating benefits are exponentially greater than traditional techniques and system operating costs are considerably lower.
1. Engineered solution
Critical factors engineering approach (model the real world) – Architect–Consulting Engineer model from building construction industry – high level of thought leadership and accountability – design for success by engineering against failure – engineers design bridges NOT to fall down.
2. Top down strategic executive approach
Executive level strategic view – essence of the business and how it thrives – driven top-down – high level of business engagement, education, involvement, organization wide, management of change, focus on decision support.
3. Precision configuration
Precision engineered strategic configuration to unique standards developed by JAR&A built on precision taxonomies – far superior to anything I have seen elsewhere.
4. Configuration management software
Use of rule based software to help with configuration and maintenance of taxonomies and configuration and to assist with on-going management of the operation of the ERP and Data Warehouse as precision machines.
5. Maximize use of permanent staff
Use of high quality temporary staff to free up permanent staff to do everything possible on the project. Limit use of contractors, use high value consultants only.
6. Laboratory
Rigorous laboratory approach – representative data samples, extreme value cases, break it till it will not break anymore, test alternative configuration scenarios, document, CBT, train, develop reports, establish data warehouse BEFORE going live.
7. Cubic business model
Scalable cubic business model to model the entire enterprise flexibly with the ability to report flexibly for Governance and management purposes – flows through into a governance and reporting philosophy with high levels of ownership and delegation. Scalable for acquisitions.
8. Decision support, analytics and modelling
Emphasis on facilitating high value decision making rippling through to all aspects of the configuration and implementation and including comprehensive reporting and analytics BEFORE go-live, including data warehouse and business intelligence – REAL BI.
9. High operating standards and training
Comprehensive training, computer based training, education of staff, standards, disciplines, typing, etc BEFORE allowed to use the system.
All the above taken together represent something that I have not seen done elsewhere, I have heard people use language that at some level sounds like this but it is not in practice.
Having said this, I have never had the opportunity to tackle a full scale project end to end in accordance with the above principles and so there is still learning involved but I am confident that the overall outcome will more than warrant the risk.
Section 1.12
Why use the JAR&A approach
The following points summarize why I think you should consider using the JAR&A approach:
1. Thought leadership
Innovation, thought leadership, accountability, work ethic – 22 years seeking to understand how to apply "the disciplines of engineering to the ERP implementation industry" – finally think I am close to having a reasonably comprehensive suite of answers that I can teach to others.
2. Wide ranging ERP exposure
Through Pulse Measurements I have been exposed to almost the entire spectrum of ERP products and have never seen an implementation by another party that conforms to these standards.
3. Never been contradicted
I have spoken at about 90 public conferences, presented about 50 public courses and published numerous articles, columns and newsletters most of which have reported negative performance statistics such as "19 out of 20 ERP implementations do NOT deliver what was promised" (Financial Mail) and "most organizations are NOT making better decisions than they were 5 years ago" (Gartner) and I have NEVER been challenged.
4. Precision is intuitively sound
The concept of precision configuration is intuitively sound – we live in a world characterized by precision and casual inspection of sloppy configurations confirms the validity of the concept.
5. First principles approach
The JAR&A approach has been built from the ground up using a fundamental first principles approach calibrated by understanding how failure occurs and how to prevent failure. I have never encountered anyone else who has applied this philosophy.
6. Taxonomies are inherent in life
The use of taxonomies is intrinsically inherent in the way other disciplines (biology, information management, library science, inventory management, etc) organize and classify information and is therefore intuitively fundamental to the organization of information in an ERP or Data Warehouse – I have taken these principles to an even greater level of precision in order to support decision making most effectively. I have yet to find another person who espouses comparable standards.
7. Taxonomies since 1977
I have been involved in the detailed design and application of taxonomies since 1977 and in the design, configuration and implementation of ERP's since 1987 with the express goal of achieving engineering levels of reliability with ERP implementations.
8. Critical issues thinking
My approach to strategy diagnosis and interpretation is critical to my approach and has developed progressively over more than twenty five years. Coupled to my critical issues thinking approach this is vital to the success of projects I undertake giving an ability to rapidly sift through huge amounts of information to distil the essence of what is important.
9. Building construction approach
The building construction orientated approach to design and project management is unique to JAR&A and is profoundly relevant to ERP implementation and business information system projects generally which are fundamentally engineering projects.
All these elements taken together distinguish the JAR&A approach to ERP implementation and offers a much higher probability of a successful outcome to much higher standards and lower overall life-time costs.
Section 1.13
Key Benefits of the
JAR&A SEPT approach to system and data warehouse configuration
Why would you read this document or, for that matter, why would you consider Strategic Engineered Precision Taxonomies (SEPT) and Configuration to the standards developed and advocated by James A Robertson and Associates (JAR&A) for your organization?
Following are a few key benefits:
1. Systems easier to configure and configuration is much higher quality
An ERP or Data Warehouse (and Business Intelligence) system configured based on Strategic Engineered Precision Taxonomies to JAR&A standards is easier to configure, will be configured faster and more precisely and to much higher quality standards than conventional configurations.
This applies both to ERP's and other operational software systems AND to Data Warehouse (DW) and Business Intelligence (BI) implementations.
This leads to lower overall operating costs AND to increased "bang for the buck".
2. Faster and more accurate posting
Because the code schemes are so logical and so easy to read operators rapidly learn their way around the hierarchies and learn the codes (which are designed to be easy to remember), and therefore post faster and more accurately. This leads to reduced costs (headcount) for the same transaction throughput or more transactions for the same headcount.
It also greatly reduces downstream time and cost resulting from inaccurate data.
3. Easier, cheaper and more accurate and more sustainable reports
The writing of reports is quicker, easier and therefore cheaper and the quality of reports is orders of magnitude higher, they are also far easier to maintain and therefore much more sustainable.
This leads to reduced operating costs, reduced time wasted, gets away from dozens of reports doing roughly the same job, gets away from multiple reports given different answers for supposedly the same query, etc.
Long term cost savings and knock on operational benefits are huge IF the SEPT taxonomies are correctly designed, implemented AND maintained.
4. Greatly reduced maintenance costs of systems and reports
As noted above, the cost of producing and maintaining reports is drastically reduced.
Major opportunities are created for MUCH more sophisticated and much higher value reports – the reports you originally expected when you signed the order!
5. Much better quality and sustainability of management information leads to faster and better decisions
The quality, reliability and sustainability of management information referred to above leads to faster and better management decisions at all levels of the organization.
Better decisions made fast reduce operating costs and allow the operation to grow with the same headcount or allows natural attrition to reduce headcount for the same outputs.
6. High levels of ownership of data improves governance and leads to improved organizational efficiency and effectiveness
The fact that the data accurately models the physical world and therefore accurately models the business removes issues of uncertainty over who owns data and therefore who owns the business outcomes. This leads to greatly improved governance and this in turn leads to greatly improved operational efficiency and effectiveness – do more for less cost.
7. Increased profitability through reduced costs and improved value adding decisions
These improvements in effectiveness and efficiency give rise to increased profitability.
Capping this with improved high value (strategic / thrive / essence of the business) decisions results in strategic effectiveness (better decisions) and efficiency (better decisions made and executed faster).
Once we have a situation where executive management and all other managers and supervisors are consistently aligned with the right things done well the overall profitability, viability and growth of the organization will far surpass those for organizations without SEPT.
The currency value of MUCH BETTER decisions is impossible to compute.
One bad decision can cost millions or even put an organization out of business.
One excellent decision at the right time can cause an organization to grow dramatically.
What value do YOU ascribe to being employed by the market leader as opposed to being part of an organization that has been taken over and is to be "right sized"?
Currency does not describe the true value of this benefit...
Section 1.14
The REAL cost of SEPT
Versus the REAL cost of conventional solutions
And the REAL value of SEPT
1. The REAL cost of SEPT – senior personnel
The REAL cost of Strategic Engineered Precision Taxonomies and Configuration is the time required from Executives and senior managers to design, implement, adopt and apply strategic taxonomies.
This is a very visible cost although the real cost of the alternative is, over time, much higher.
2. External advisor
SEPT will generally require a more senior, more experienced and more expensive advisor and facilitator than the alternative approaches, again this extra cost is, over time, outweighed by the serious inefficiencies of the conventional approach.
3. Software
Precision taxonomies and, particularly the Cubic Model, are almost impossible to maintain without software that guides operators and maintains standards.
This is a very visible cost although the inefficiencies that result from the alternative approach rapidly consume far more than the software cost.
4. REAL cost of traditional solutions – lost management efficiency and bad decisions
The REAL cost of traditional solutions – badly structured or unstructured lists is first and foremost through lack of high quality management information delivered in a timely manner that supports better decision making. The biggest cost is the lost opportunity cost and business risk that results from bad decisions or delayed decisions and wasted management and executive time.
5. Direct costs of traditional solutions
Traditional solutions carry substantial hidden direct costs such as additional staff costs, higher than necessary audit costs and other operational inefficiency costs.
6. REAL value of SEPT – gained management efficiency and better decisions
The REAL value of SEPT lies in faster access to information, much more information available, immediate answers to every question, answers to questions not previously thought of, etc -- all resulting in improved management efficiency which allows the organization to grow without additional management and administrative complement.
There is also a potentially massive, but hard to quantify, benefit relating to decision making efficiency – less time to reach decisions and decision making quality – better decisions. One really good decision can be worth millions or even tens or hundreds of millions as can one bad decision avoided.
7. Direct savings associated with SEPT
The effective implementation of Strategic Engineered Precision Taxonomies and Configuration also leads to considerable operational and direct savings in terms of reduced consultant / contractor costs, reduced headcount (through natural attrition) or increased throughput for existing headcount, reduced wastage, increased efficiency at all levels, reduced audit costs, etc.
The real costs and real value must be understood in order to make a sound business investment decision when embarking on a SEPT project.